This is what
complete business visibility
looks like
Integrated dashboards for Shopify, Meta Marketing, Google Ads, Sage, and Xero.
Designed to give e-commerce businesses a clearer view of performance, profitability, and growth.
Two layers of visibility for better insight
Platform-specific dashboards
Each connected platform has its own dashboard, showing the metrics that matter most for that platform — from revenue trends and ad efficiency to cash flow and profitability.
Unified dashboards
Bring data from every platform into a single view, so you can track true ROAS, full-funnel conversion, and profit across your business as a whole.
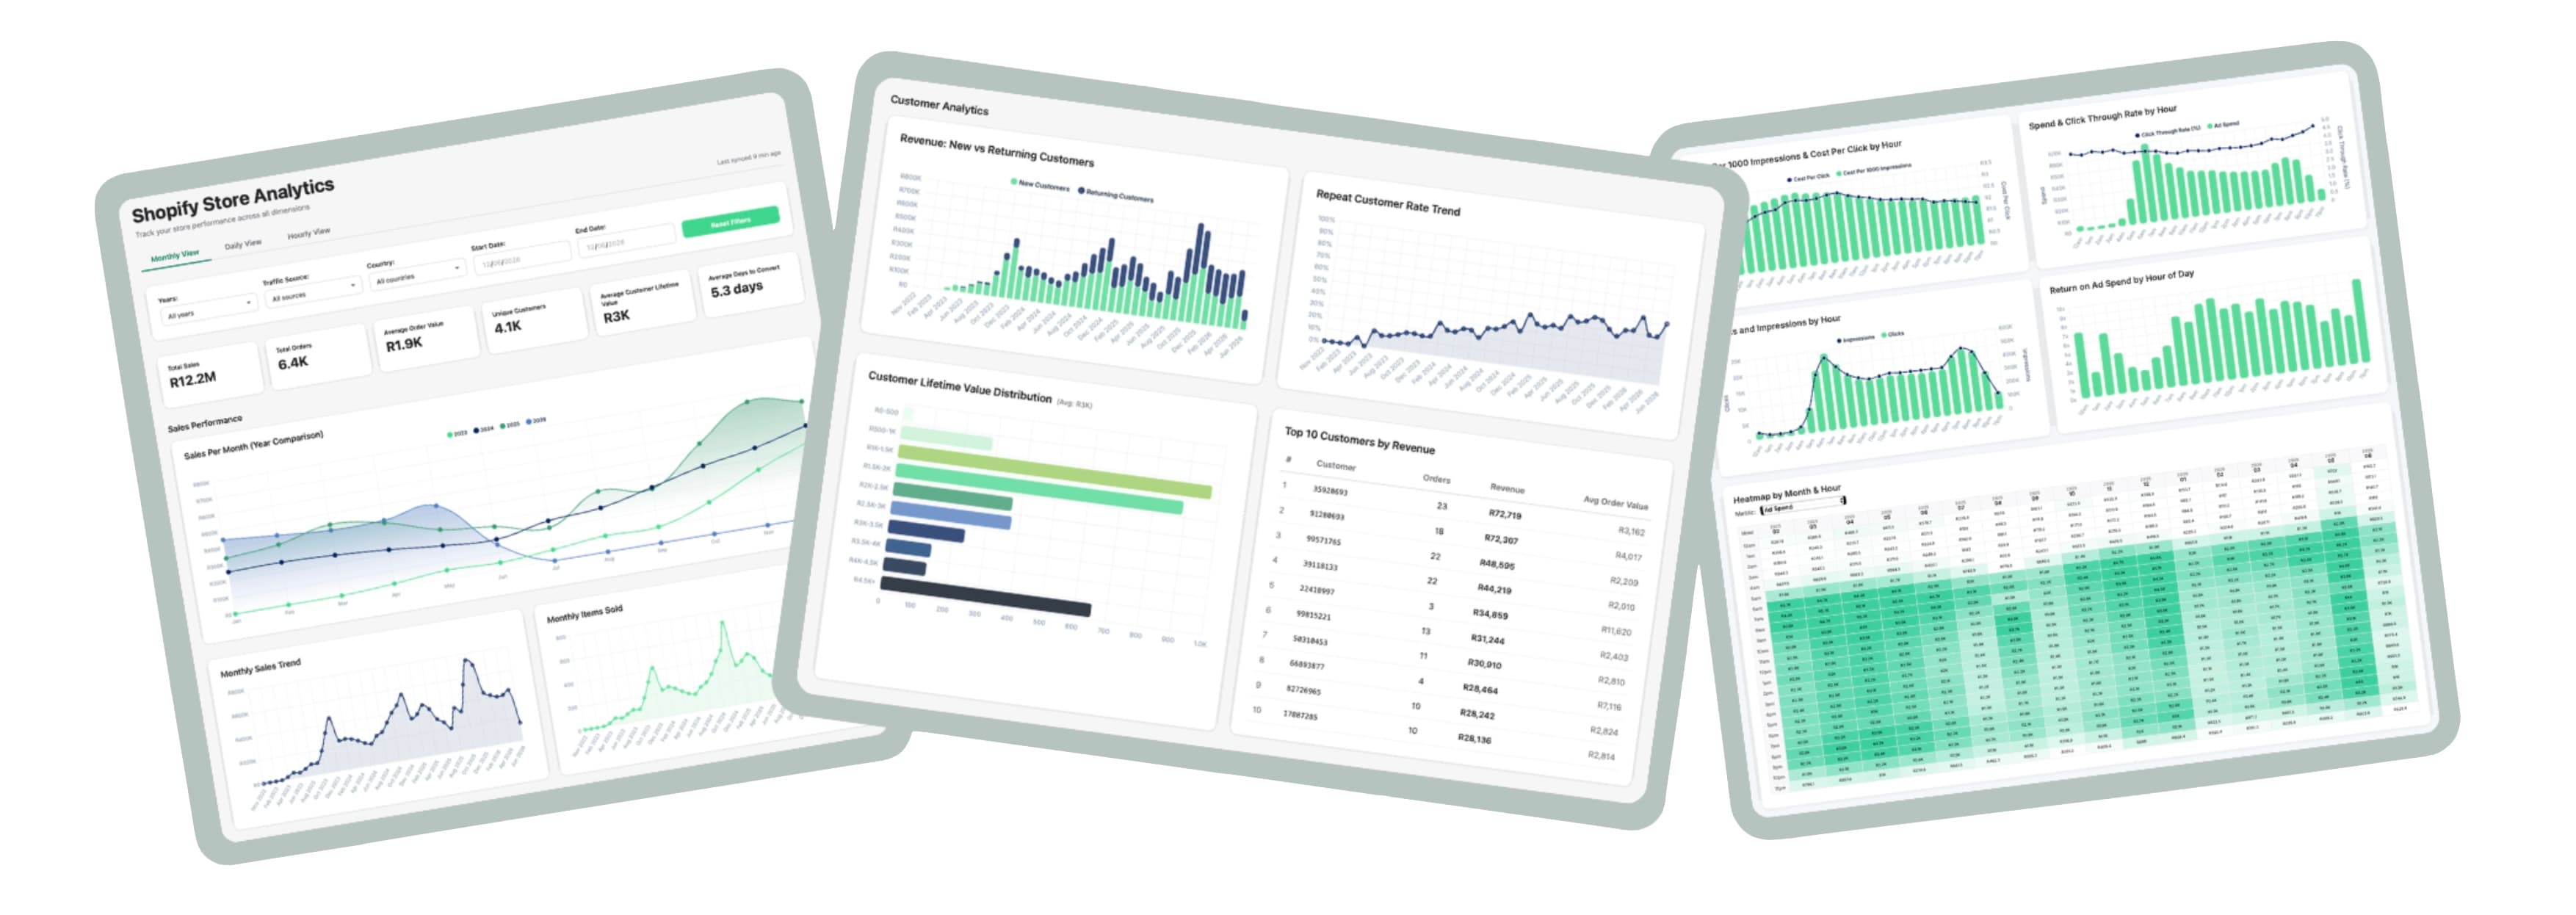
Platform-specific dashboards
Shopify Store Analytics
Track store performance across sales, customers, products, attribution, and geography
Sales Performance & Order Analytics
Monthly and yearly sales trends, items sold, average order value, discount rate, and refund rate.
Customer Analytics
New vs returning revenue, repeat customer rate, customer lifetime value, and your top customers by spend.
Product Performance
Revenue and units sold by style, vendor, and product type.
Marketing Attribution
Revenue traced back to first-visit source, campaign, and marketing medium, plus time-to-convert analysis.
Geographic Breakdown
Revenue by country and province, and by fulfillment and payment status, so you can see where and how you sell.
Daily & Hourly Patterns
Daily trends over the last 90 days, sales and orders by day of week, and hourly revenue by customer type and geography.
Unified dashboards
Cross-platform analytics that answer the questions no single dashboard can.
Ad Spend and Revenue
See your Meta and Google ad spend alongside Shopify revenue in one graph. Calculate your true return on ad spend using actual sales data, not platform estimates.
Cross-Platform Attribution
See Shopify revenue attributed back to Meta and Google by channel and campaign, right down to the hour of day, so you know which platform actually drives sales.
Optimise Your Spend
Understand which campaigns and performance indicators are most closely linked to revenue, so you can allocate ad spend more effectively.
True Profit, Not Just Revenue
Combine Sage or Xero accounting data with sales and advertising performance to understand true net profit across the business, not just top-line revenue.
Margin and Cost Tracking
Combine cost of sales and operating expenses from Sage and Xero with Shopify revenue to watch your margins move over time.
True Cost per Customer
Measure customer acquisition cost by comparing Meta and Google ad spend against new Shopify customers, then evaluate it alongside customer lifetime value.
Built for e-commerce businesses that want to harness the power of their data
Shopify Store Owners
Track sales, orders, customer lifetime value, and product performance without exporting CSVs from Shopify admin.
Marketing Teams
See Meta and Google ad spend alongside Shopify revenue in one chart. Calculate true ROAS using actual sales data, not the platforms' estimates.
Finance and Operations
Connect Sage or Xero accounting data to your e-commerce metrics. See profit margins, not just revenue.
Multi-Market Sellers
See geographic breakdowns by country and province. Understand where your customers are and where your ads perform best.
Meet your
AI Analyst
Your dashboards display your data. Your AI Analyst turns it into clear, actionable steps.
Ask questions such as “Where are we wasting ad spend?” or “Which products contribute most to profit?” and receive clear, data-backed answers based on your sales, marketing, and accounting data.

Monthly performance reviews
sent to your inbox
Receive a monthly performance review with key insights, performance analysis, and practical recommendations.


Are you ready to make data-driven decisions?
Connect your Shopify, Meta Marketing, Google Ads, Sage, and Xero accounts and get access to a complete view of your business performance